If you have not deployed your IDX app yet, follow the Deployment guide first.
Overview metrics
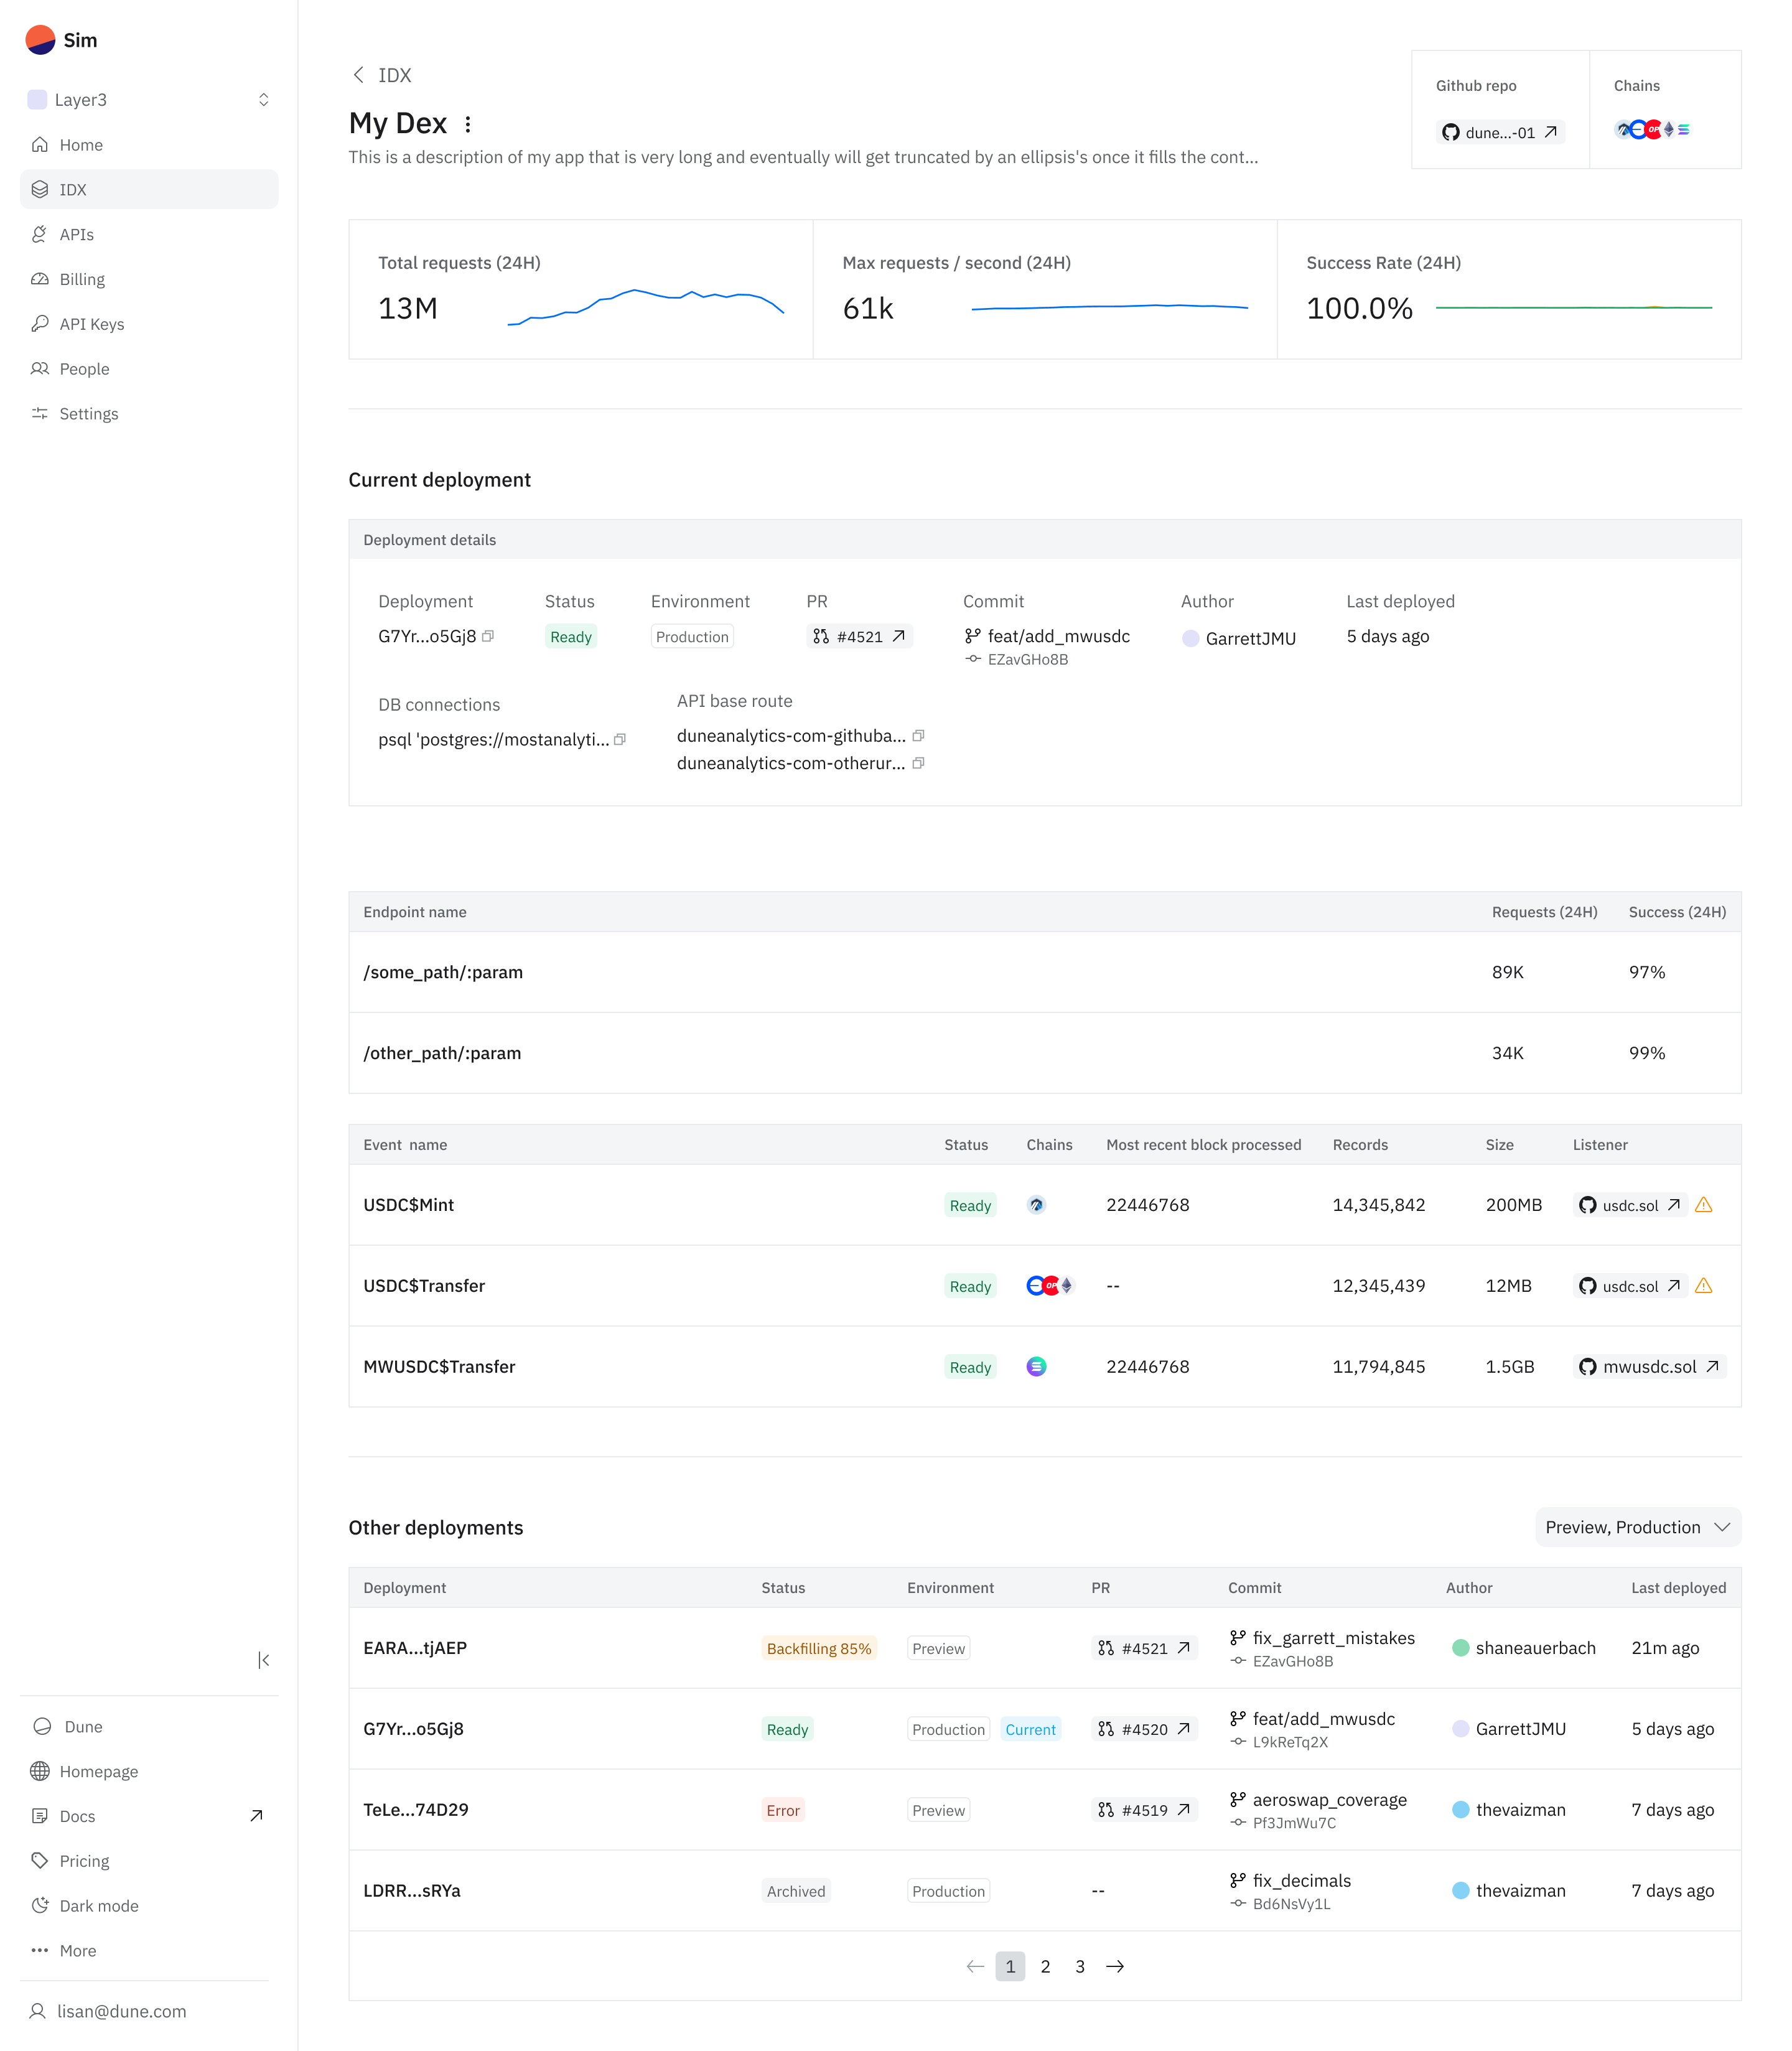
At the very top you will see a stats bar that summarises your app’s activity: the chains it indexes, the connected GitHub repository and API metrics such as total requests, peak RPS and success rate over the last 24 hours. The numbers update live so you can leave the tab open while you ship new endpoints.Current deployment
This card shows the build that is currently serving traffic. It displays the Deployment ID (unique UUID for this deployment), Environment (Production points to themain branch while Preview builds are generated for branches other than main), Commit (Git SHA together with the GitHub author), and Last deployed (relative timestamp).
When a build is running the status badge moves from Building → Ingesting → Ready. Previous builds stay available in the Other deployments.
During Ingesting, real-time indexing is live and historical backfill runs to completion. The backfill re-triggers only when you change your Listener Contract. See the full details in Build and Ingestion Lifecycle.
DB connection
A Postgres DB connection string is issued for every deployment. It follows the patternpsql, Supabase Studio, DBeaver or any other SQL client to explore your tables directly.
API base routes
Two base URLs are generated:- Latest: always points at the newest deployment, be it preview or production.
- Production: permanently mapped to the most recent production build in the
/mainbranch.
Endpoints
Every endpoint that you add to your API appears here with usage statistics and a status badge. Click an endpoint to view detailed usage metrics.Events
If your app emits events you will see an Events table. For each event you can view:- Status (Running, Paused or error).
- Latest processed block.
- Total records stored.
- Disk size consumed in the DB.
Other deployments
The Other deployments panel lists every build that ran for this app. For each row you can:- View the deployment hash, status, environment and commit.
- Open build logs to debug failures.